If you are having problems on the site, Live Chat site support is now available directly on every page during normal office hours. After hours you can leave a message that is added to the support queue. It is a quick and easy way to ask a question and get a fast...
read more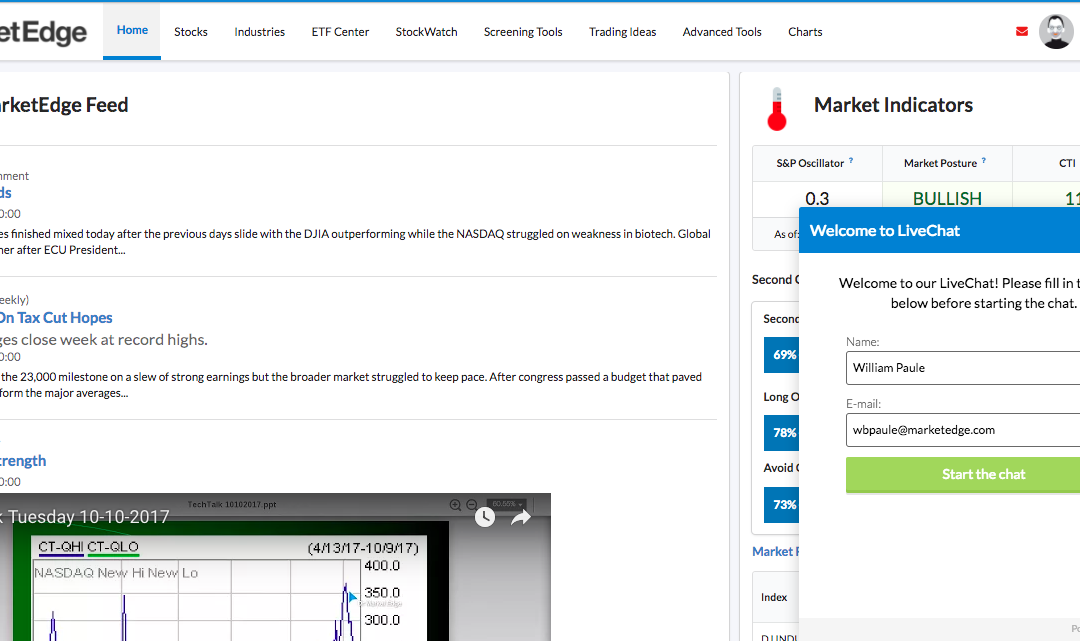
Live Chat Site Support

If you are having problems on the site, Live Chat site support is now available directly on every page during normal office hours. After hours you can leave a message that is added to the support queue. It is a quick and easy way to ask a question and get a fast response.
At the bottom right of every page you will see a link that says either “Chat Now” or “Leave A Message”. Click on the link and a window will pop up for you to type a message and chat with a support representative.
If nobody is available and you leave a message, you will get an emailed answer when the next support agent is available.
Live Chat Site Support

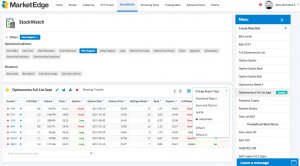
New QuickChart
All New Interactive Quickcharts give you the flexibility you need to identity trends.
read more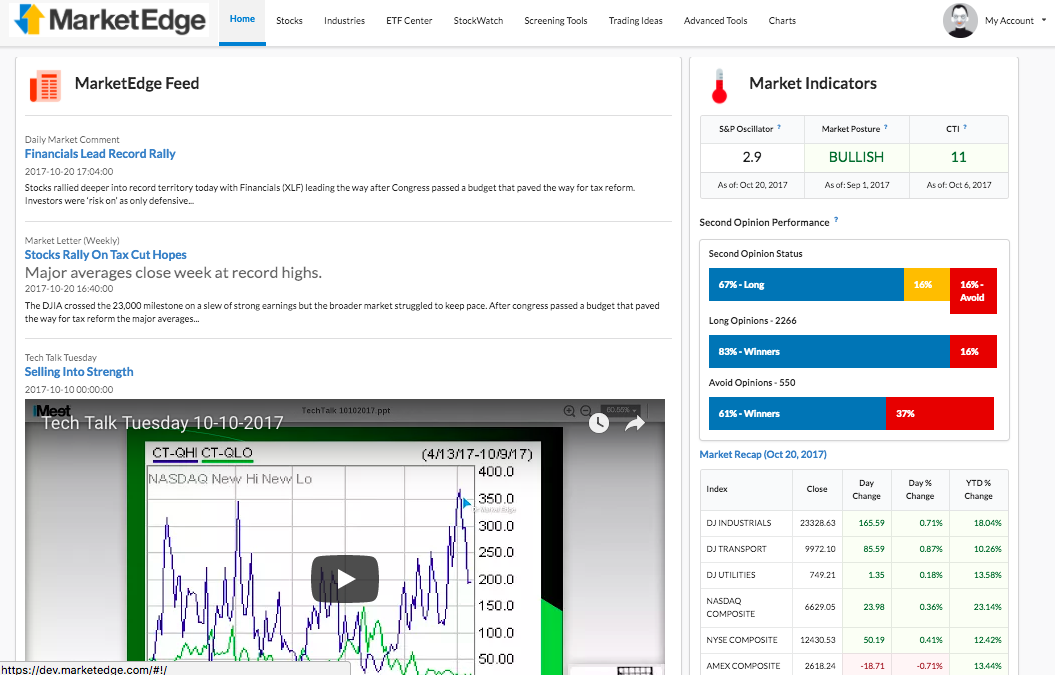
New Homepage
New Home Page combines the old Home and Markets pages for a single place to get started.
read more
New Second Opinion
The Second Opinion Report, the heart of MarketEdge, has been redesigned to so you get a more complete picture.
read more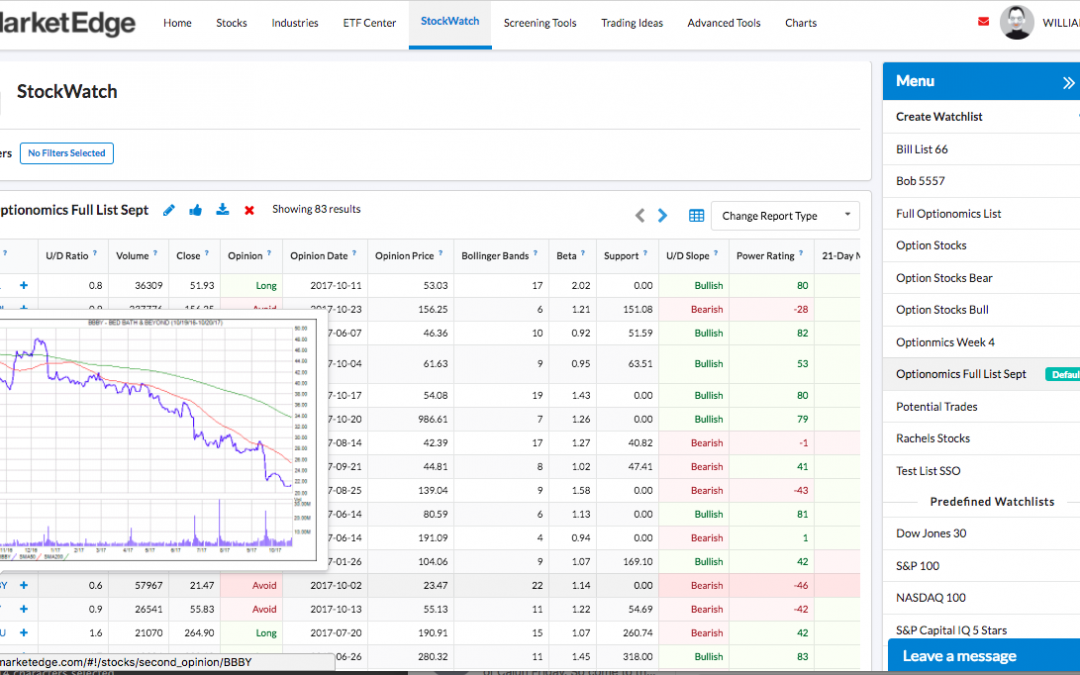
New Stockwatch
We spent a lot of time on Stockwatch and in a word, it is AWESOME!
read more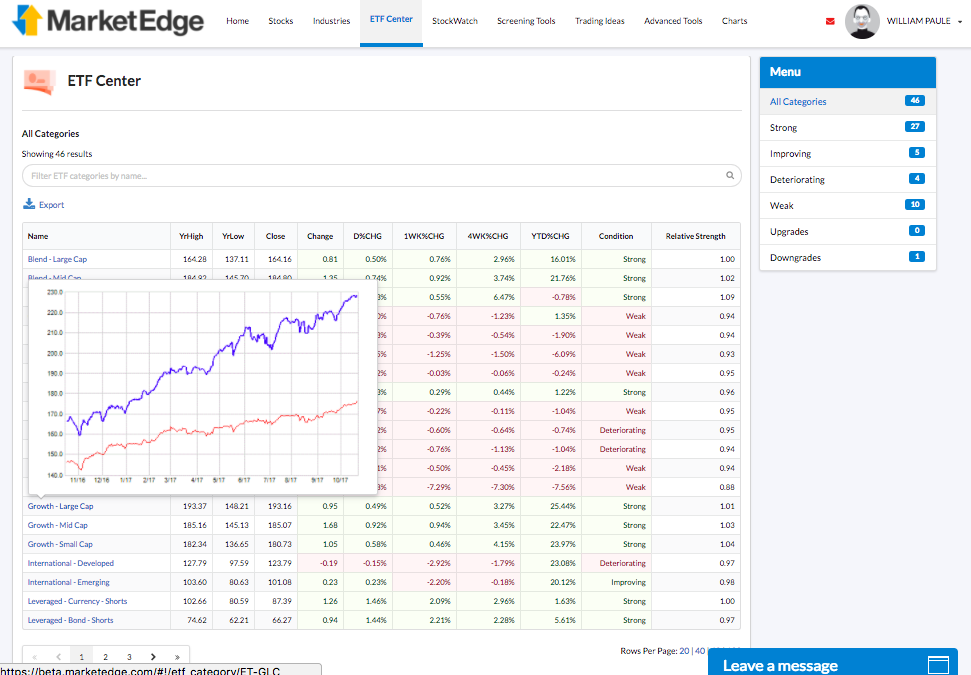
New ETF Center and Industry Groups
New ETF Center and Industry Groups give you faster access to the categories you want.
read more
New Screening Tool
Interactive filter results, Add List to Stockwatch, Export to spreadsheet and save your favorite filters.
read more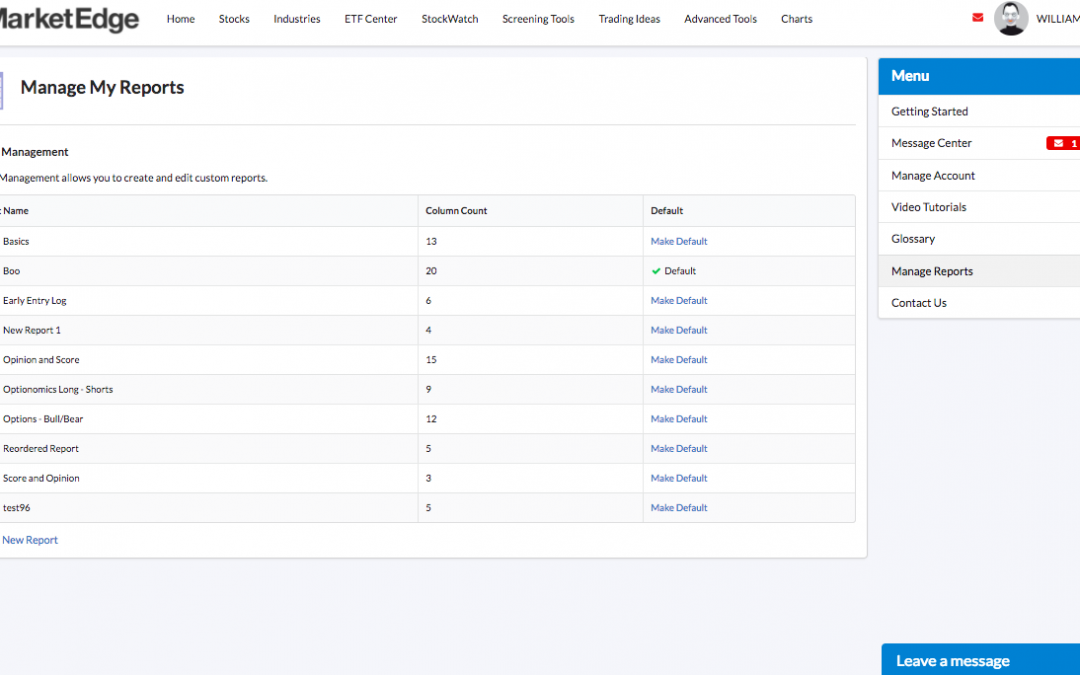
New Custom Report Formatting
Report Manager brings drag and drop report layouts to the New MarketEdge
read more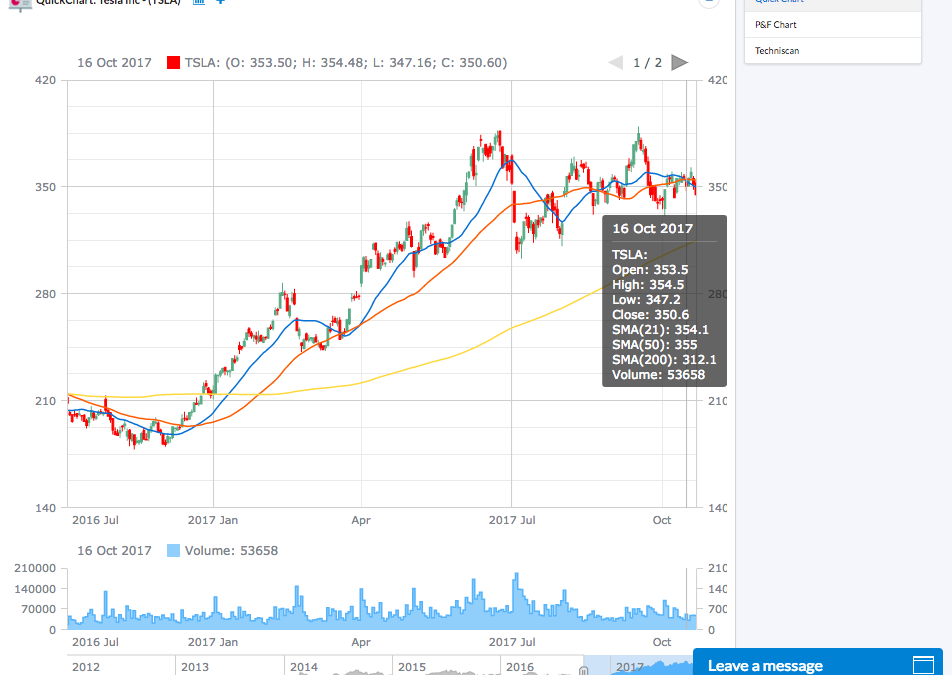
New SmartCharts
Chart Tools that are native to your browser means no downloads or complicated configurations.
read more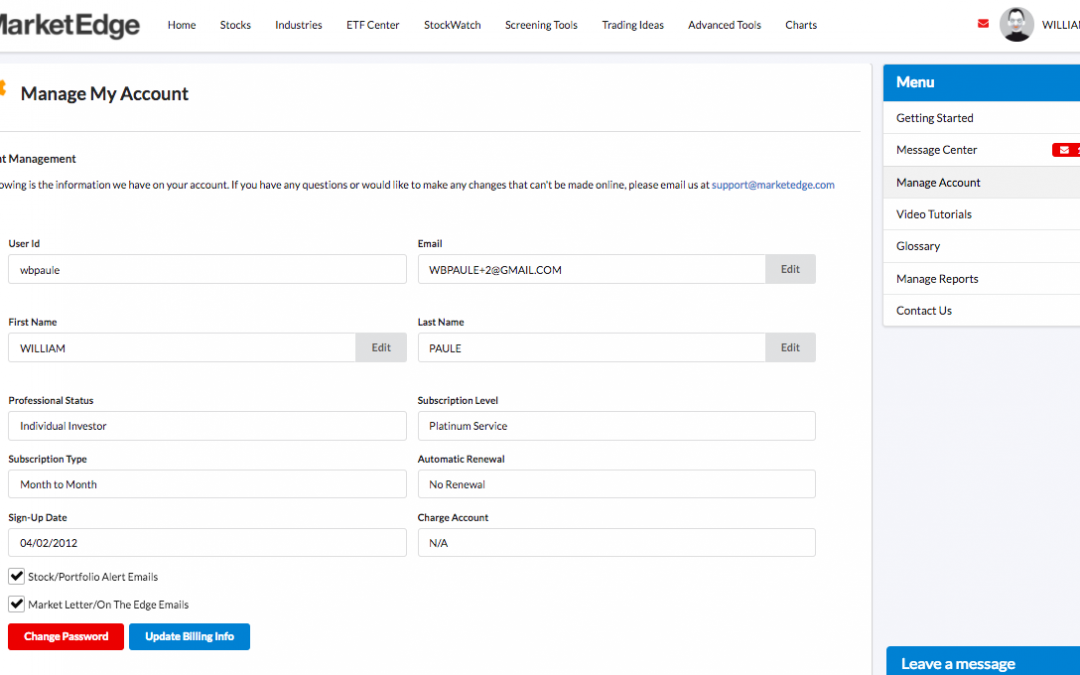
New Account and Help Center
Everything you need to manage your account and learn how to use MarketEdge in one place.
read more