
Take MarketEdge with you! The new design works on your Phone and Tablet too.
read more
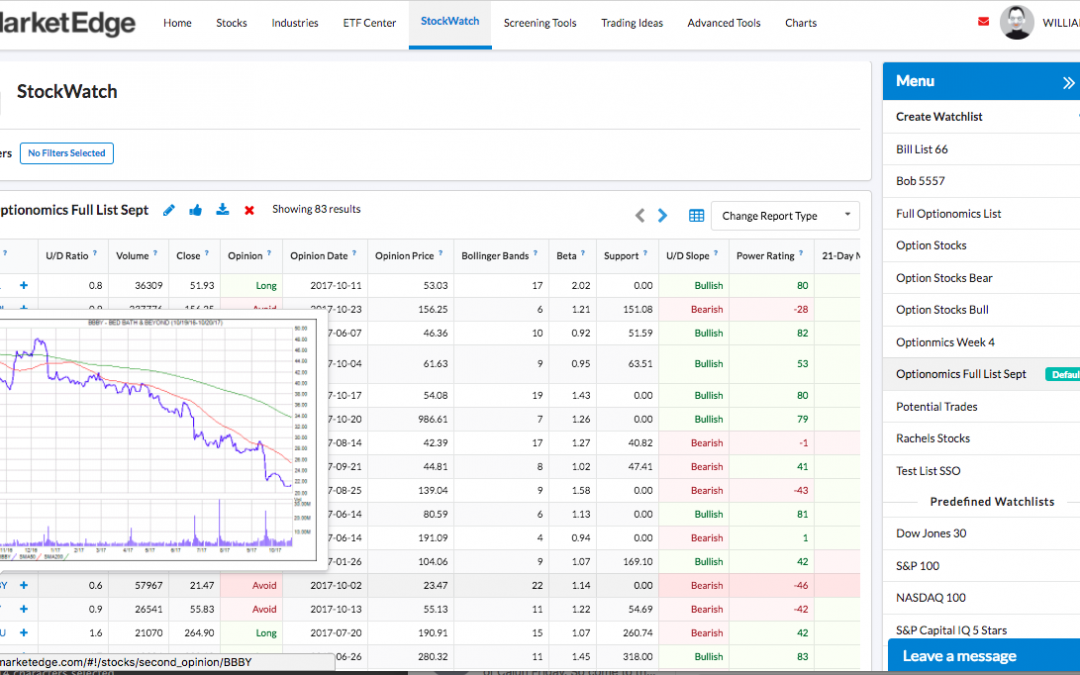
New Second Opinion

The Second Opinion report is the heart of Market Edge so we took great care in every change we made. With this in mind we made one BIG change to the report that we think you will like – CHARTS.
We added two charts to the Second Opinion Report, a long term (annual) chart and a short term (just over 1 month) chart. By rolling your mouse over the charts, they will change back and forth from Annual to Monthly. Try it yourself!
What is New with Second Opinion?
- ROLLOVER CHARTS!!!
- Definitions Everywhere
- Easily get definitions when you need them without jumping to the glossary
- One Click Add to Stockwatch
- Click the + at the top of the report then select a Watchlist and the stock is added to the list. OK, so technically it is two click but Wow! Wasn’t that easier?
- Jump Straight To Smartcharts
- Click the Chart Icon to jump straight to SmartCharts and load the stock. No downloading Java or configuring your browser, the new SmartCharts is compatible with all modern browsers!
- View Stock Industry Groups with One Click
- Click ‘View Industry Groups’ on the title bar to get a list of industry groups and see their current ranking.
- Click on one of the listed industries to jump right to the Industry Group report for that Industry.
- Easily jump to Company Profile, Financials, Quick Chart and Point and Figure Charts
- For a limited time get access to the MarketEdge Techniscan Reports – Details reports that the Pros use.
AND LiveChat Site Support Everywhere!